In a previous post, I offered a broad overview of the problems related to minerals needed for the clean-energy transition. To recap:
clean-energy technologies are more minerals-intensive to build than their fossil-fuel counterparts;
the growth of clean energy will rapidly raise demand for a set of key minerals;
mining and processing of those minerals is geographically concentrated, often in countries with weak labor and environmental protections;
mineral mines and processing facilities often pollute water, scar landscapes, and impoverish communities;
production may not be able to expand fast enough to keep up with demand, which could cause supply constrictions and price fluctuations and slow the transition away from fossil fuels.
That’s the big picture.
In today’s post, I want to take a take a closer look at some of the biggest clean-energy technologies and the minerals required to build them. Specifically, I’ll cover batteries, solar PV, wind, geothermal, concentrated solar, and carbon capture and storage (CCS). I’m not going to get too deep into any one of these — just a quick tour.
I’ll be drawing heavily on a 2020 World Bank report that projects demand for key minerals under rapid decarbonization scenarios from the International Energy Agency (IEA) — specifically the RTS (reference technology scenario, or current policy), 2DS (2-degree scenario), and B2DS (beyond 2-degree scenario, aiming for 1.5). (The World Bank and IEA use the word minerals to refer to the mineral and metal value chain, and I do the same in this post.)
This tour will reveal which minerals are expected to be most in demand — which ones are certain to be needed and which depend on the direction taken by particular technologies. It will help focus attention on possible supply stress points.
It will also reveal that there is enormous uncertainty about the pace and scale of demand growth for specific minerals and minerals generally. Much depends on unpredictable developments in technology, policy, and politics. Epistemic humility is called for, along with policy focused on resilience. (More on policy in the next post.)
One fact that is certain: the more ambitious the world’s decarbonization efforts, the higher mineral demand will rise.
Here’s an overview table of energy sources and technologies and the key minerals they use:
Let’s start the tour with the 800-pound gorilla of minerals demand: batteries.
Batteries are the biggest growth sector for minerals demand
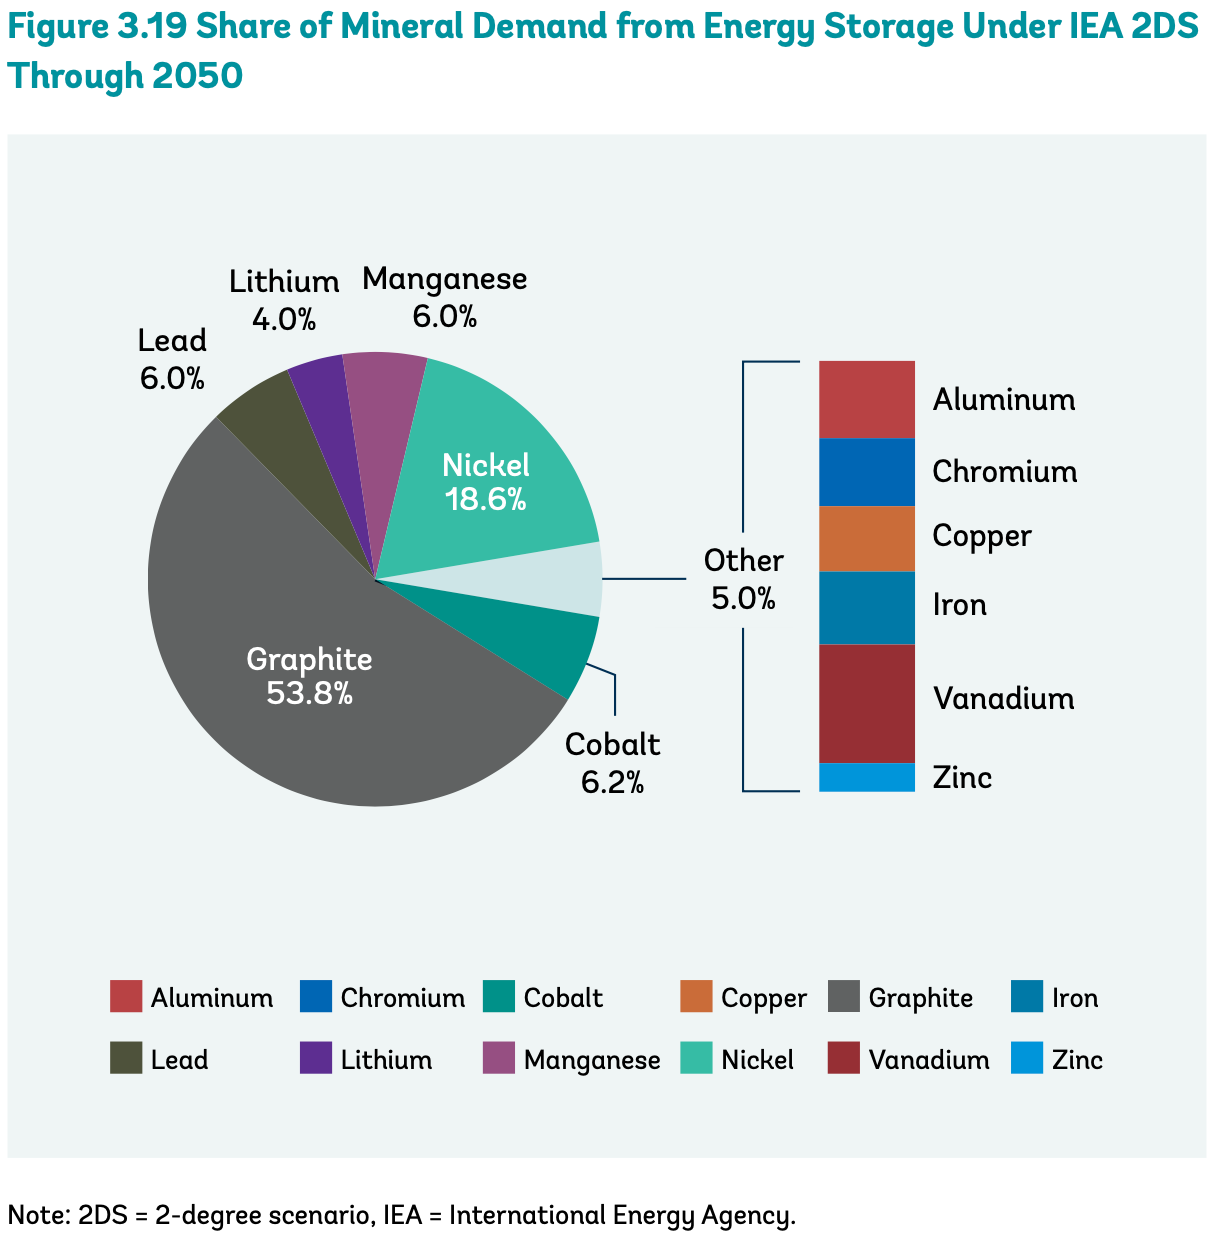
Of all the clean-energy technologies set to boom in coming decades, none will put a strain on minerals supply like batteries, shown as energy storage in the chart above. They account for about half of the projected growth in minerals demand over the next two decades in a rapid decarbonization scenario.
In large part, this has to do with the expected rise in battery-powered electric vehicles (EVs), which represent 90 percent of battery demand growth; the other 10 percent will come from growth in stationary storage, used to balance out wind and solar on the grid.
If the world targets 2°, minerals demand from energy storage will double from the baseline scenario; if the world targets 1.5°, it will more than double again.
Batteries, readers of my battery series will recall, are composed of two electrodes, a cathode and an anode, and an electrolyte through which they exchange ions. (The outlier is redox flow batteries, which pump a liquid electrolyte past electrodes.)
Depending on what those three parts are made of, batteries require different minerals. Many EVs still use lead-acid batteries, which use lead and sulfuric acid, but lithium-ion batteries (LIBs) are expected to rapidly take over the market, so demand for lead-acid batteries won’t grow much.
As for LIBs, most use graphite as the anode, which means graphite will be the most sought-after mineral in energy storage. Cathodes vary more widely. The most common use nickel, with various mixes of cobalt, lithium, and manganese also common. (It should be noted that lithium is used across all LIBs, not just for the cathode.)
It should be noted that these projections out to 2050 are to a large extent guesses, just an extension of the “average” LIB into the future. In fact, LIB technology could evolve a number of different ways, and other storage technologies could play bigger roles in subsequent decades.
“The assumption that Li-ion batteries dominate both the mobile and stationary market for the next decade is conservative,” the World Bank writes. “Post-2030, the scale of uncertainty is much greater, with a wide range of options in both markets.”
Consider the options for LIBs. For cathodes, NMC111 batteries use one part nickel, one part manganese, and one part cobalt, while newer NMC811 batteries use much more nickel and less cobalt. Tesla and other automakers are trying to eventually eliminate cobalt from their batteries; it’s too early to say how far they’ll get.
Right now, almost all anodes are graphite (a market dominated by China) but there is active development of zinc-air batteries that use air as the anode, sodium-ion batteries that use hard carbon as a anode, and solid-state batteries (which replace a liquid electrolyte with a solid one) that use lithium as an anode. What mix of technologies will triumph is still an open question, which means the precise trajectory of graphite demand is tough to predict.
If manufacturers seek to minimize cobalt, demand for nickel will rise. If solid-state batteries catch on, they could reduce demand for graphite. If zinc-air batteries catch on, they could dent demand for lithium, graphite, nickel, and manganese.
Post-2030, other storage technologies like flow batteries or a wide array of long-duration storage techs could become competitive. It depends on the evolution of policy and the electricity mix. Also worth noting: the practice of using second-life EV batteries as a form of grid storage could take off, which would trim total demand for new batteries.)
Finally, LIBs have made substantial advances in materials efficiency and those will likely continue, which could effect how sharply demand rises. (Read this RMI report for a bullish take on improvements in LIBs’ energy density.)
In terms of how geopolitically concentrated and environmentally destructive they are, the big minerals to watch here are graphite, nickel, lithium, and cobalt, but it’s impossible to know their precise mix in advance.
Solar voltaics love aluminum and copper
Solar is another technology that we are confident is going to grow like mad in coming decades, but it’s difficult to predict the exact trajectory of minerals demand.
The World Bank paper looks at four common PV technologies: crystalline silicon (crystal Si), which makes up about 85 percent of the current market, and three different “thin film” technologies that can be printed on flat sheets: copper indium gallium selenide (CIGS), cadmium telluride (CdTe), and amorphous silicon (amorphous Si).
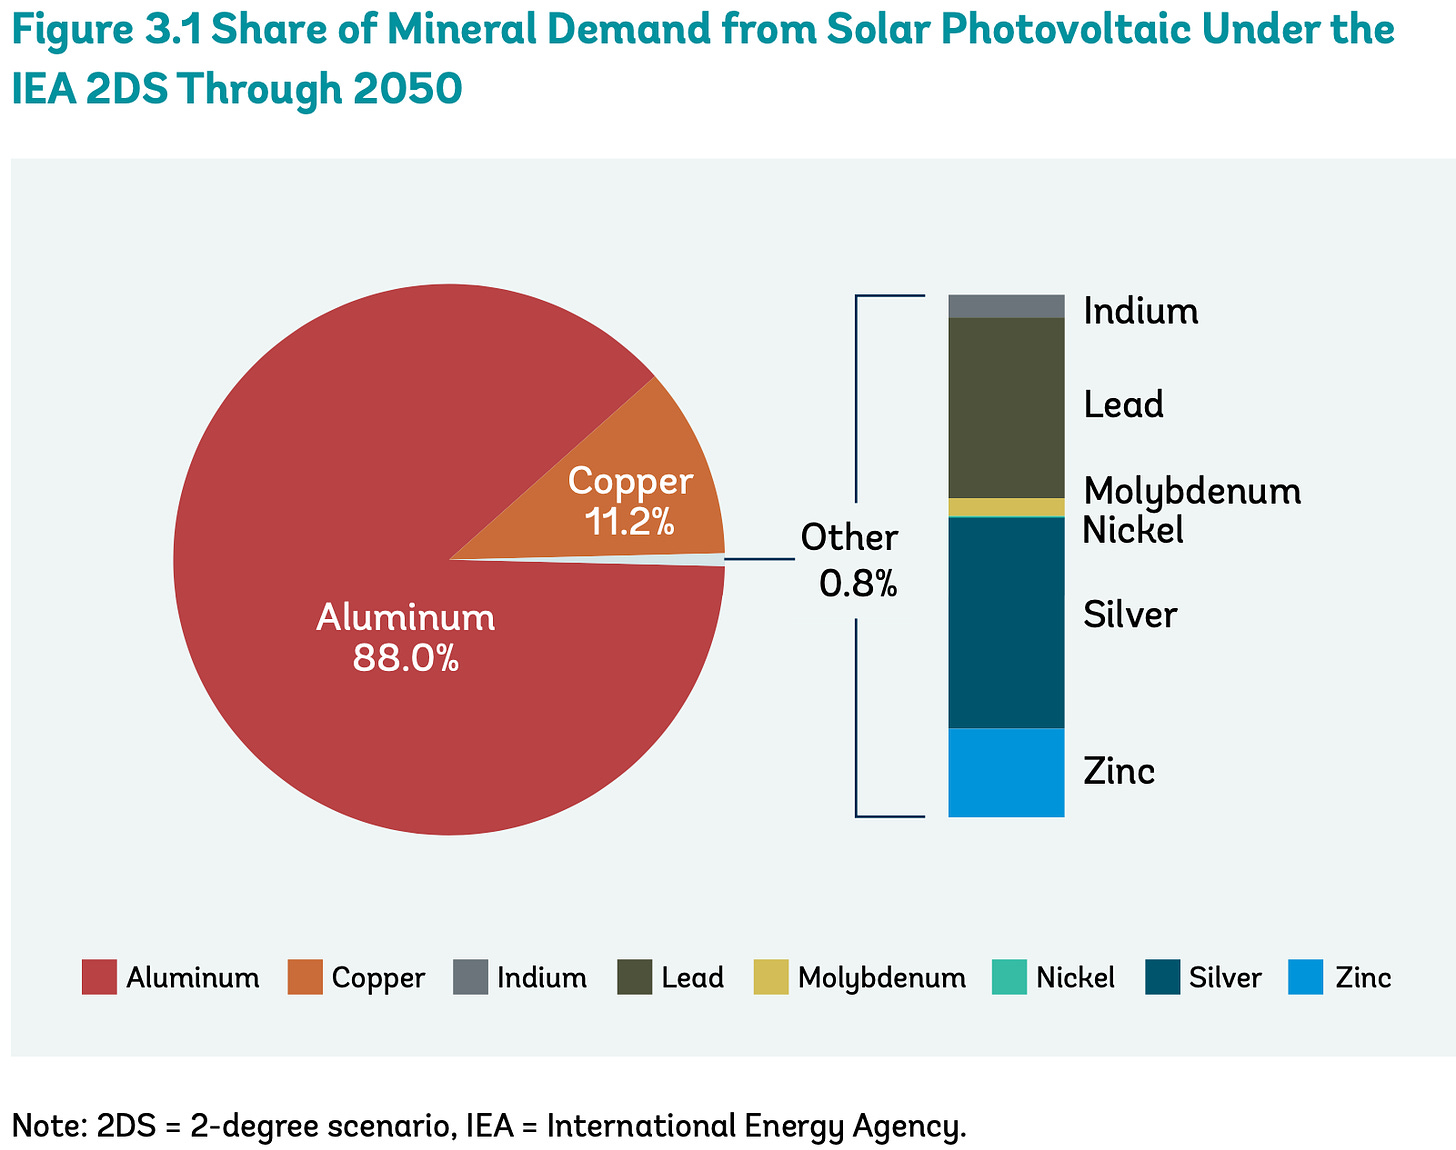
All four are made primarily with aluminum, copper, and silver, with different additional minerals contributing to different technologies. In terms of overall size, aluminum and copper are the biggies:
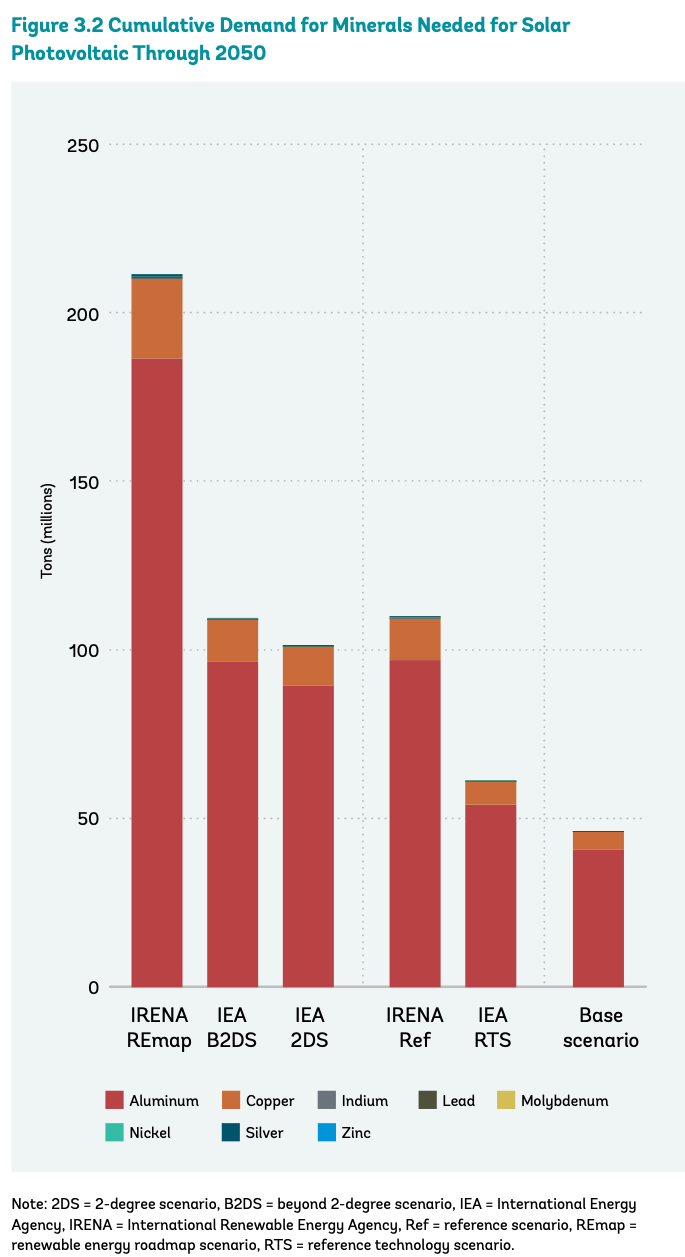
In the comparison below, the World Bank includes two scenarios from the International Renewable Energy Agency, which tends to be more bullish on PV and batteries than IEA — a renewable energy roadmap (rapid decarbonization) scenario and a reference scenario. In IRENA’s roadmap scenario, demand for both minerals rises 350 percent from baseline through 2050.
Depending on which scenario you favor, demand for aluminum and copper from PV is either going to grow a boatload or a mega-boatload.
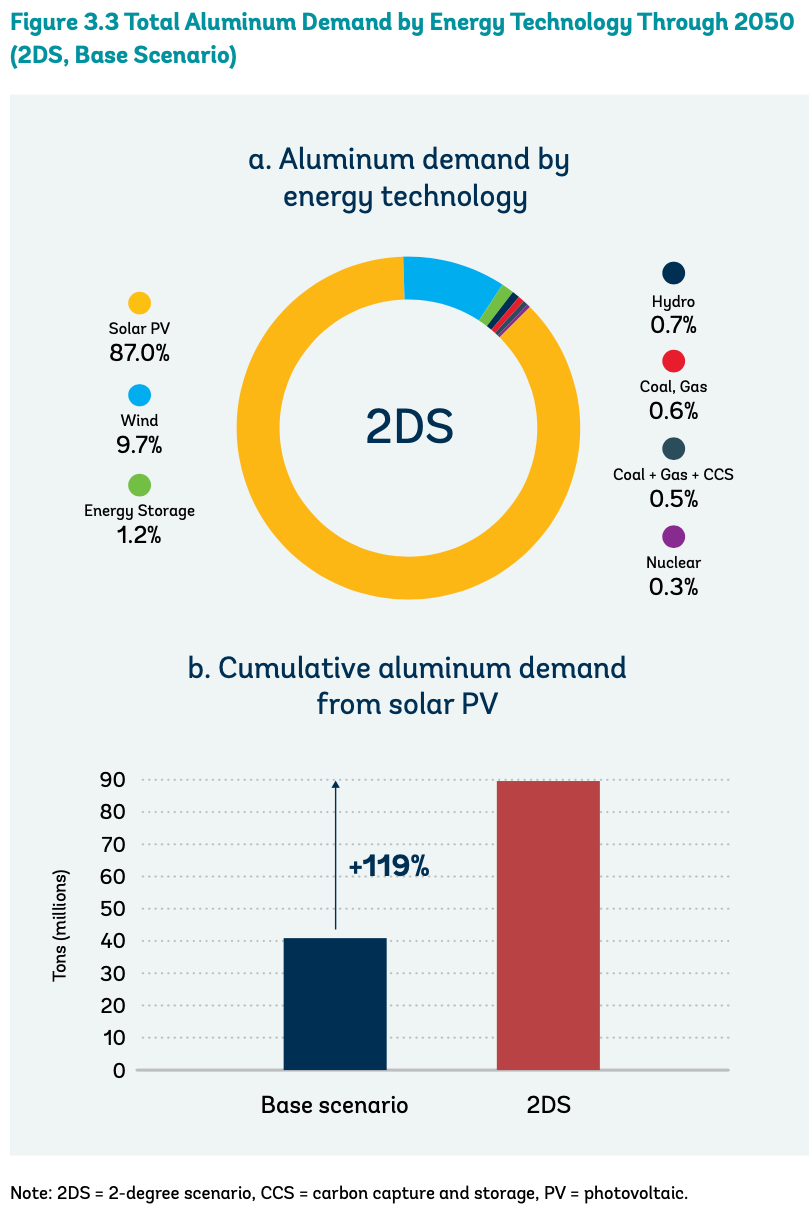
Aluminum — not itself a raw mineral, but a product of bauxite reduction that produces alumina, which is then smelted — plays a role in almost all energy technologies, but solar is the biggest source of demand in the energy sector, by far.
When it comes to copper, clean-energy technologies — batteries and solar, but also transmission and distribution systems — are the fastest growing source of demand. In a 2-degree scenario, clean energy’s share of total copper demand will rise from today’s 24 percent to 45 percent. It’s going to drive a lot of new copper mining.
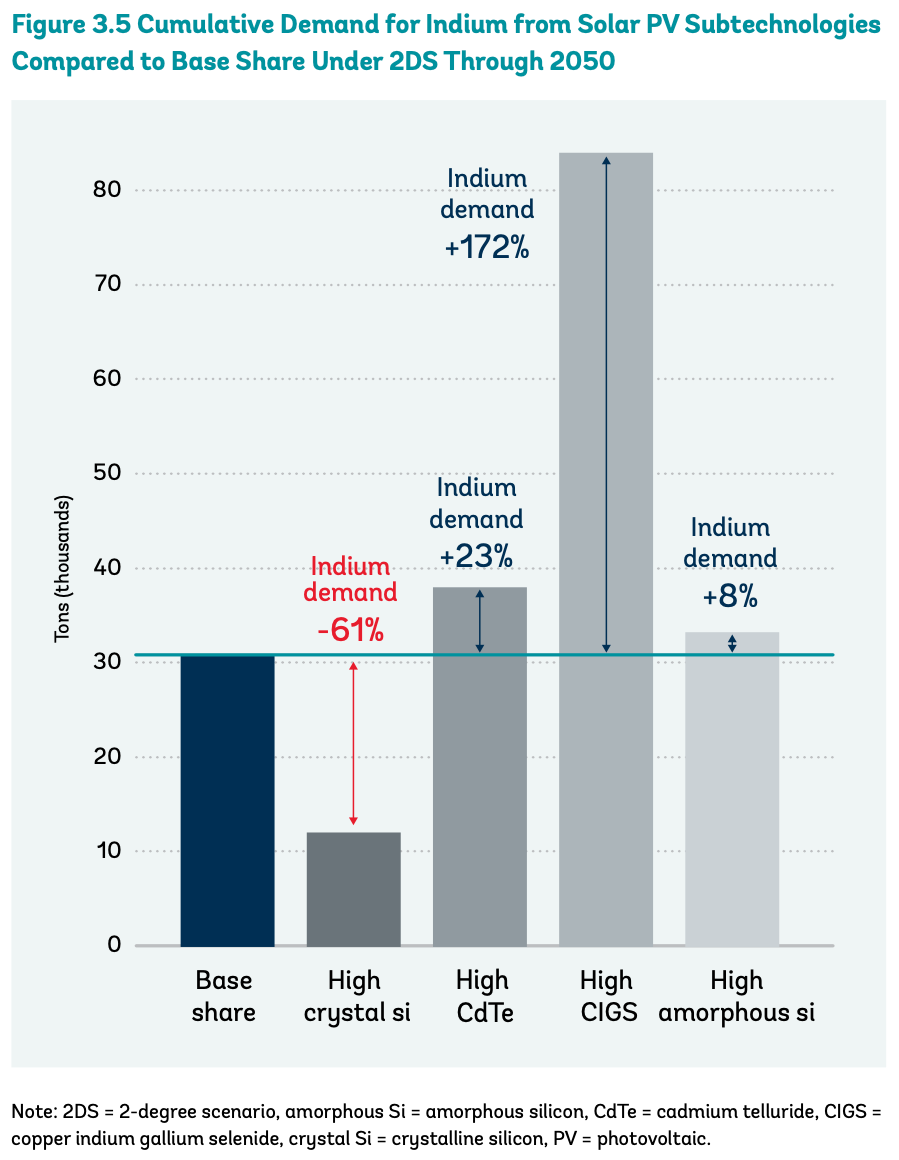
Demand for aluminum and copper will likely be robust no matter which way solar PV evolves, but for some minerals, the direction the technology takes has bigger consequences. For example, almost all (97 percent) of the indium used in the energy sector is for solar PV — specifically, thin-film solar PV.
“The current literature expects this subtechnology to grow, and in the model, the three thin film subtechnologies — CIGS, CdTe, and amorphous silicon — are assumed to grow from 20 percent to 50 percent of solar panels,” writes the World Bank. If that doesn’t happen, if old-fashioned crystal-Si panels continue to get ludicrously cheaper and crush all competition, it could cut energy sector demand for indium to very little.
Other minerals like silicon, gallium, and tellurium are also sensitive to the direction of PV markets.
Anyway, in PV, aluminum and copper are the biggies, but several rare earth elements are in play too, depending on future technology choices.
Wind turbines are big on steel
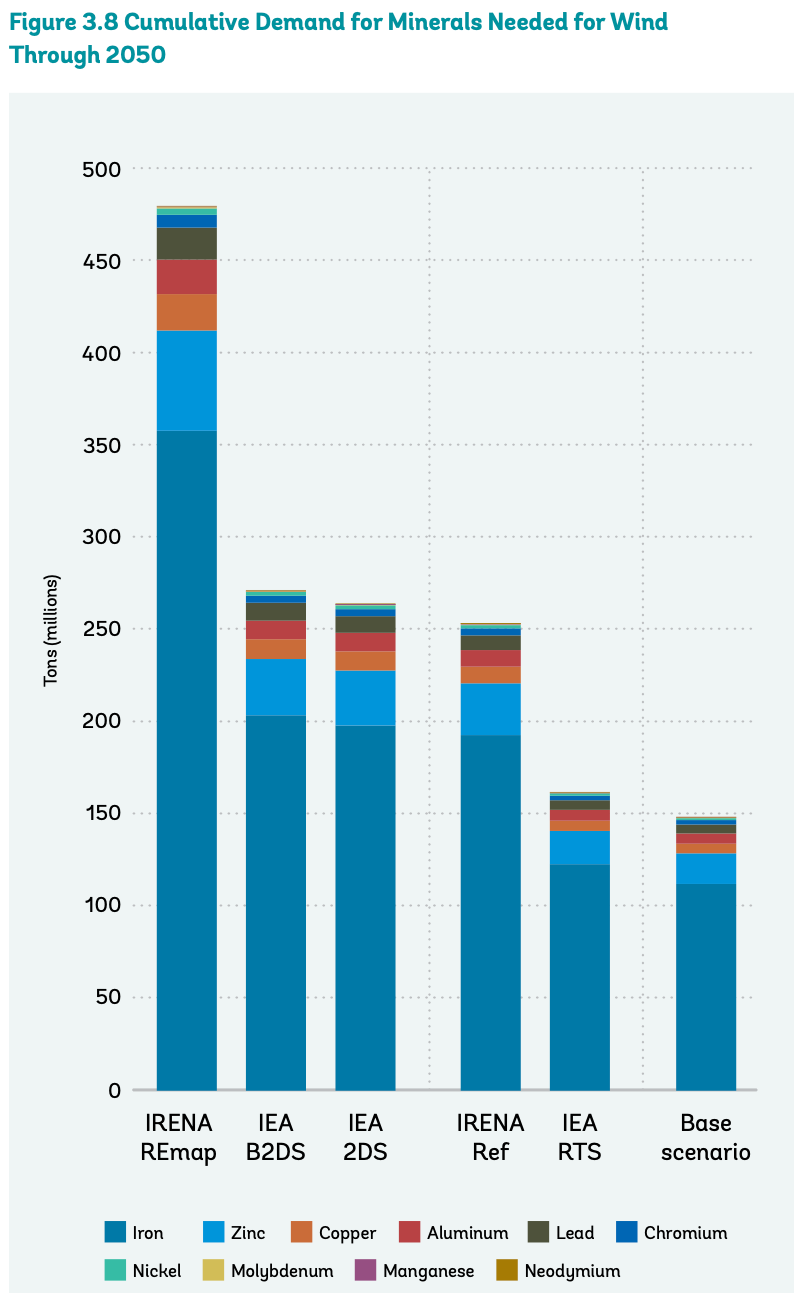
Wind turbines are made mostly of steel for the turbines (the manufacture of which, depending on the details, can involve nickel, molybdenum, titanium, manganese, vanadium, or cobalt), with lots of copper for cabling and iron for other parts.
Most of those materials are common in other clean-energy technologies. The one mineral for which wind is the primary demand is zinc; wind would boost demand at least 80 percent in a 2-degree scenario.
Most onshore wind farms use geared turbines, which “use a gearbox to convert the relatively low rotational speed of the turbine rotor (12–18 rpm) to a much higher speed (1,500 rpm) for input to a generator,” the World Bank writes. Around 80 percent of current global wind capacity is geared turbines, attached to generators that use lots of iron and copper.
In direct-drive turbines, the generator is affixed to the rotor and turns at the same speed. These are more common in offshore installations, due to their lower maintenance requirements. They often use permanent magnets with rare earth elements.
Some minerals will be greatly affected by the ultimate balance of onshore and offshore turbines, like neodymium, a rare earth element used only in permanent magnet direct-drive turbines. A 2-degree scenario in which offshore wind grows faster than expected could spike demand for neodymium almost 50 percent relative to the base case; if onshore grows faster, it could sink neodymium demand by almost 70 percent.
(Read this piece for the bullish case on direct-drive turbines. Another big unknown is the possible penetration of “switched reluctance motors,” which are both cheaper than current induction and synchronous motors and don’t need a gearbox or rare earth elements for a magnet. See here for more on that.)
So for wind: lots more steel, zinc, iron, copper, and, depending on the evolution of turbine technology, a few rare earth elements.
Geothermal, concentrated solar, and CCS are small mineral players
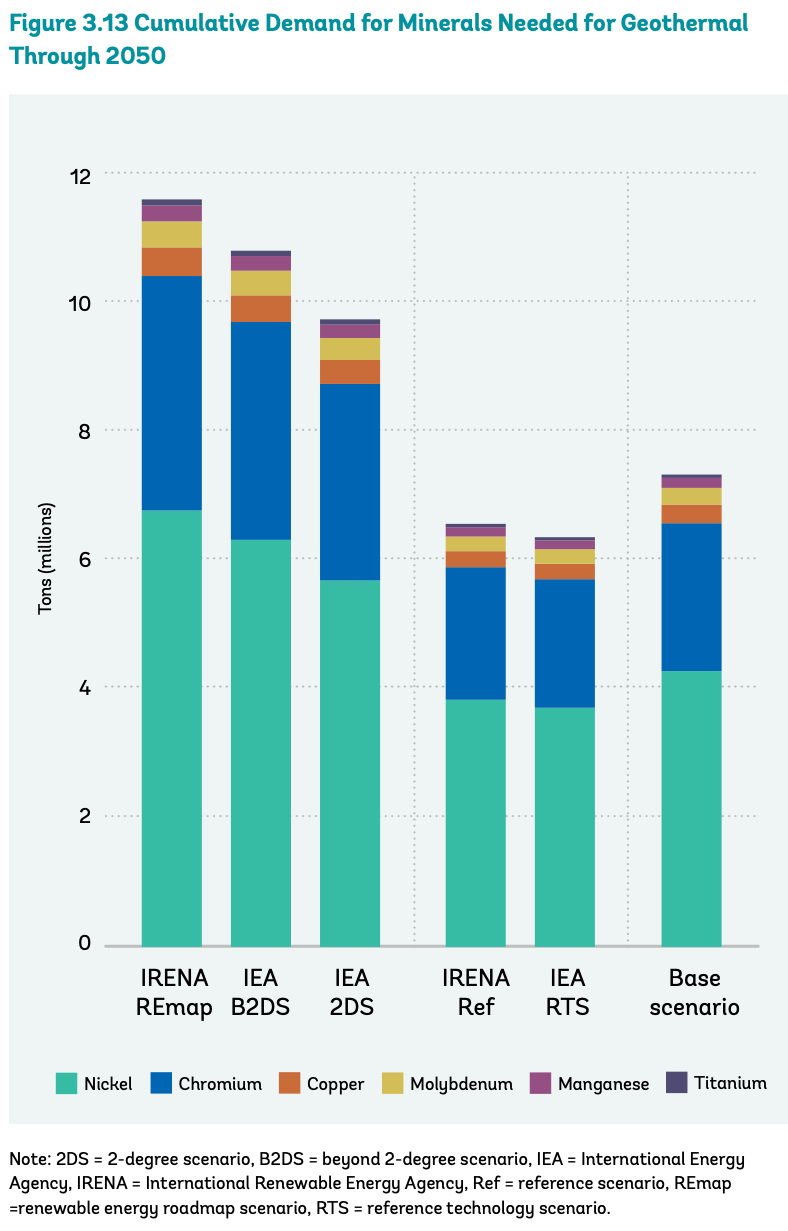
Geothermal power is a relatively tiny portion of global electricity capacity and is likely to remain so even under optimistic growth scenarios.
As it grows, it will demand special steel alloys designed to resist heat and corrosion, which involve several rare earth elements. It also requires nickel, chromium, copper molybdenum, manganese, and titanium.
The only mineral for which geothermal is likely to be a significant chunk of demand is titanium; it is the main user in the energy sector. In a 2-degree scenario, demand for titanium for geothermal will rise 80 percent or more.
Concentrated solar power remains a fairly niche technology — more expensive and geography-dependent than PV — and is expected to grow, but not much. The only minerals of note that it uses are copper and silver, and it is not likely to represent a substantial portion of demand for either.
Carbon capture and storage uses chromium, cobalt, copper, manganese, molybdenum, and nickel, but no one is sure which CCS technology will win out or how much will be built, so it’s anybody’s guess how much.
The big picture
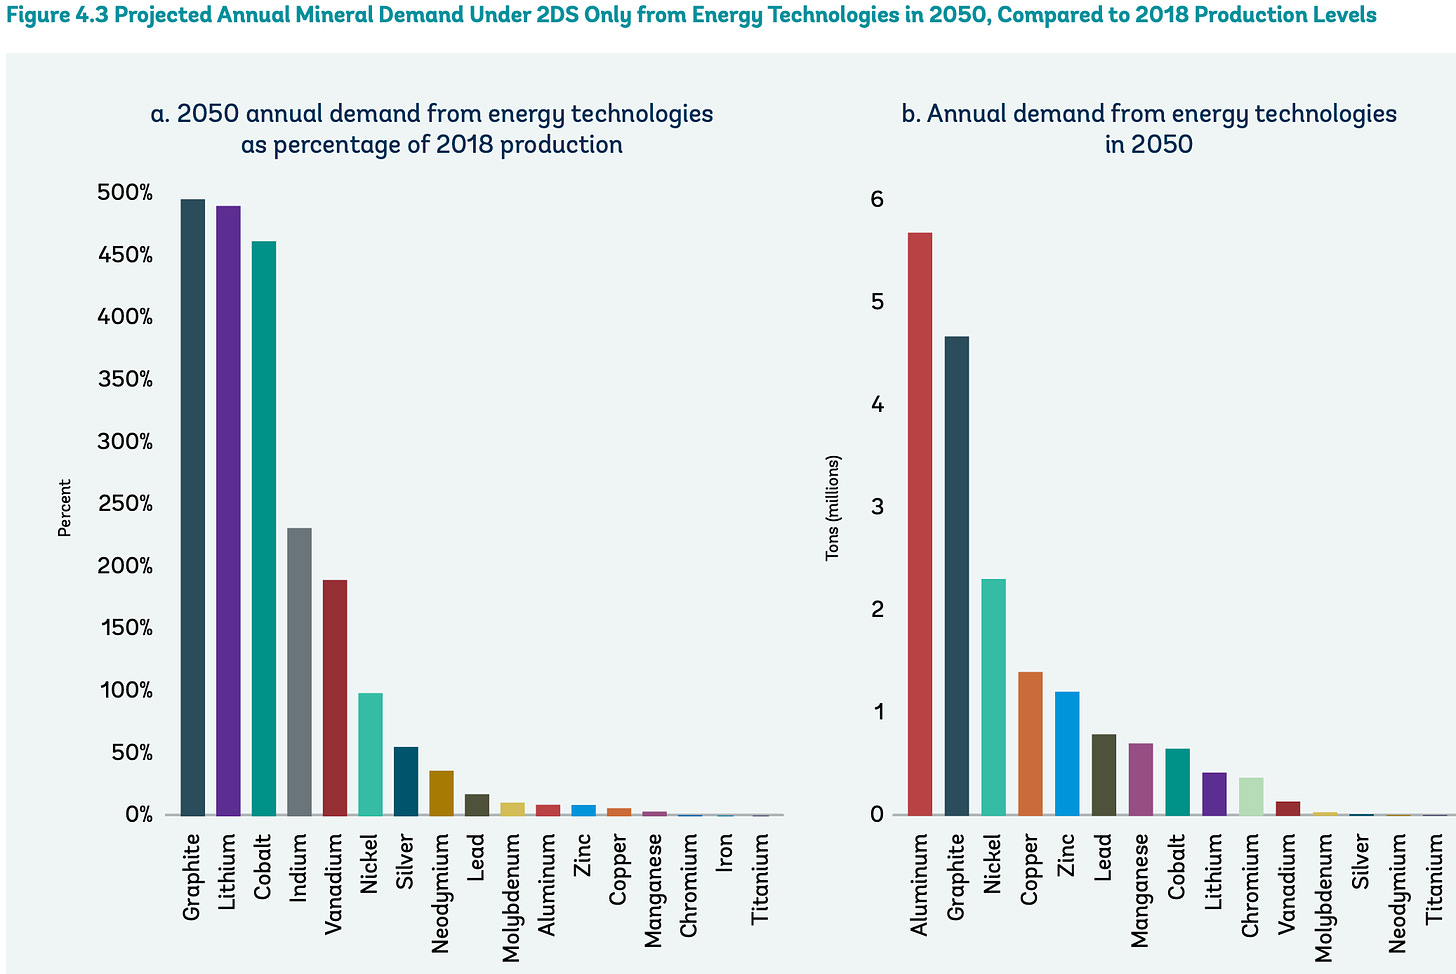
The World Bank’s figures “demonstrate an overall increase in demand for as many as 11 minerals used across a variety of energy technologies, with iron and aluminum showing the highest absolute increase, followed by copper and zinc.”
Here’s a graphic that shows relative increase in demand for a variety of minerals (on the left) and absolute increase in demand on the right.
As you can see, graphite grows by the largest percentage and by the second largest total amount — as a key component of batteries, it is key to the transition.
For some minerals, though demand does not increase a huge amount in absolute terms, they are starting from a small base and markets will grow by close to 500 percent, including lithium and cobalt, or around 200 percent, like indium and vanadium. Those could be stress points.
Some minerals will grow substantially in absolute terms, but relatively little in percentage terms, like copper and zinc, which are used widely outside the energy sector. (Although note: the World Bank analysis does not include copper for transmission lines, which could be a big source of growth.)
And then there’s nickel, somewhere in the middle.
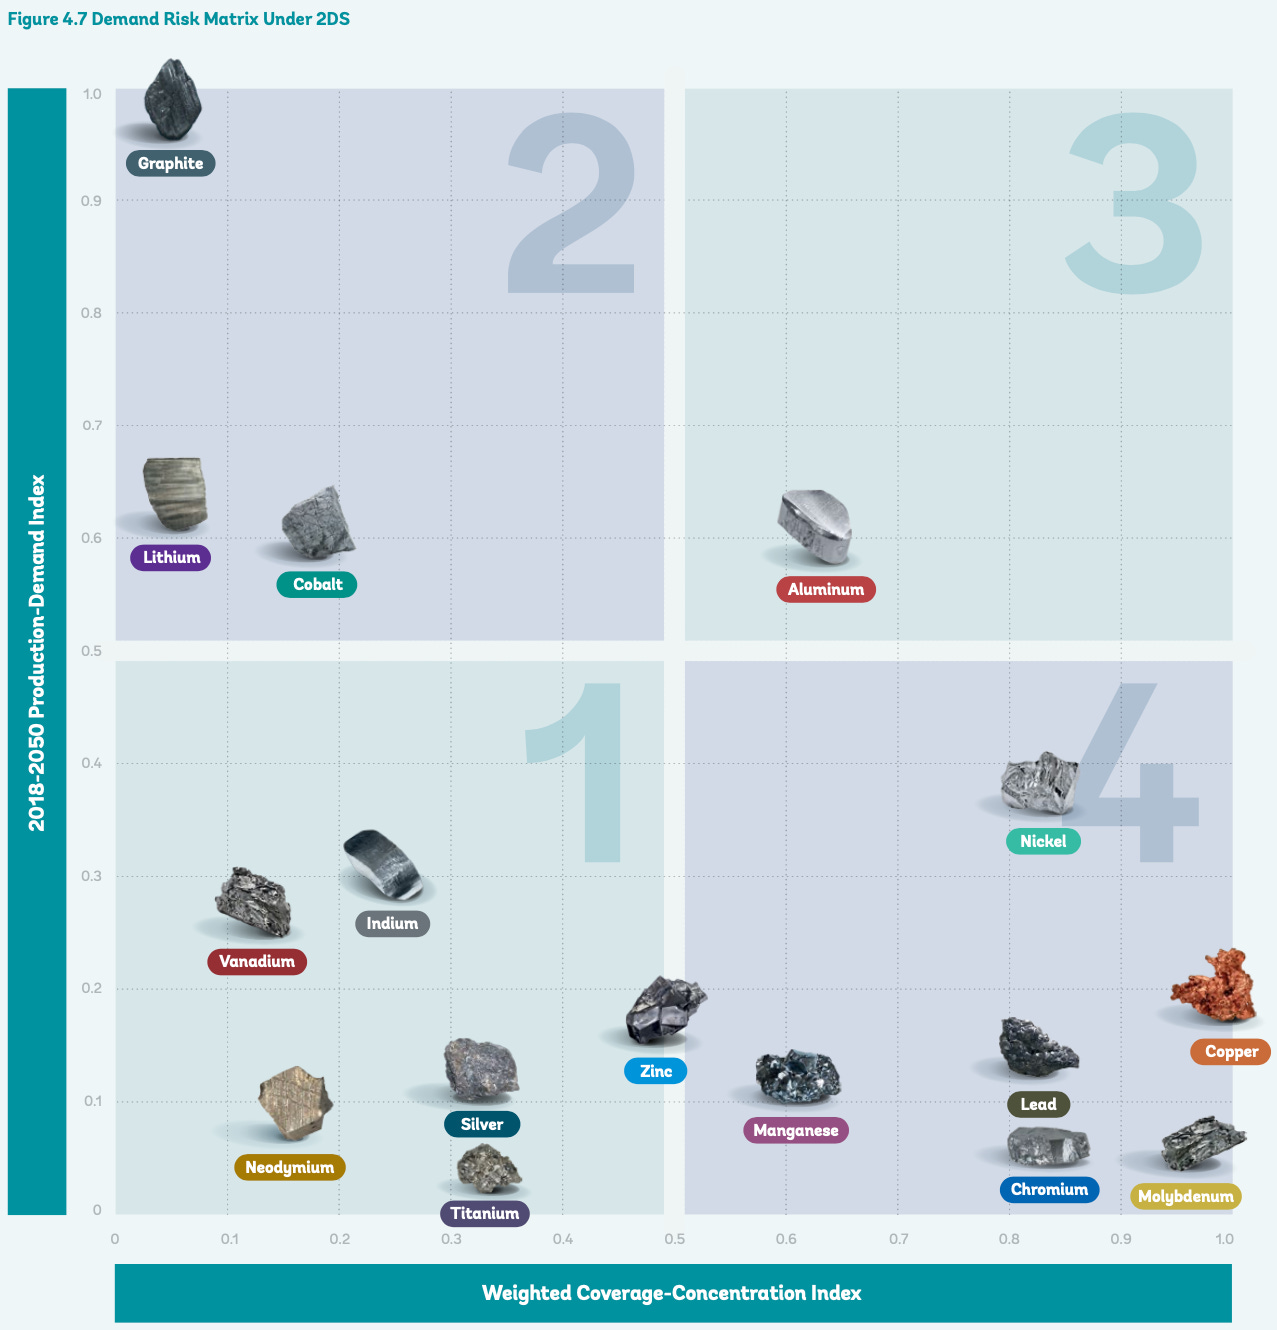
To try to get all this information in one place, the World Bank created a risk matrix for minerals under a 2-degree scenario. Importantly, the matrix doesn’t capture risks related to environmental dangers or possible supply constraints. It only captures demand dynamics.
The horizontal axis — “weighted coverage-concentration index” — measures how cross-cutting a mineral is. To the left are minerals used in fewer energy technologies, whose fates are tied closely to the fate of those technologies; to the right are minerals common to many technologies, for which demand is likely to rise no matter which technologies win out.
The vertical axis — “2018-2050 production-demand index” — is a weighted measure combining relative and absolute demand growth. It captures, roughly, how much demand for the mineral is expected to grow. On the top are minerals that will experience large demand growth; on bottom, less growth.
The four quadrants of this matrix provide a way of categorizing minerals and their demand risks.
Quadrant one contains medium-impact minerals. They are used in a small number of clean-energy technologies and their overall growth will be modest. These include zinc, silver, titanium, and several rare earth elements.
Quadrant two contains high-impact minerals. They are only used in a handful of technologies (principally batteries), but demand is expected to increase rapidly and substantially. These are graphite, lithium, and cobalt — which are among the most environmentally nasty of the bunch in terms of mining and processing.
Quadrant three contains the highest-impact minerals, which are both crucial to a wide array of technologies and expected to grow quickly. For now, that only describes aluminum. It comes from bauxite mines, which are not great (no mines are really great), but it is one of the most recyclable and recycled materials in existence. Almost 75 percent of the aluminum made in history is still in use.
Quadrant four contains cross-cutting minerals, which won’t see dramatically rising demand like quadrants two and three but are vital to a broad array of technologies, which means growth in demand is quite certain and predictable. Copper is the big one here, used in pretty much every clean-energy technology, but nickel is going to grow even more. Lead, chromium, molybdenum, and manganese also qualify.
So that’s the risk matrix. It points to which minerals will be most in demand.
It turns out, as we saw in the previous post, that some of the most important minerals to the clean energy future are geographically concentrated and mined under socially and environmentally dubious circumstances. Processing is almost entirely dominated by China.
What should we do about that? More on that in the next post.






Share this post